Bollard Pull Calculations for Towing Operations – an Introduction
Part I – Calculating the required Bollard Pull (BP)
by | Feb 4, 2017 |
SECTION A – INTRODUCTION
Bollard Pull calculation is one of the most frequent calculations performed in marine towing operations.
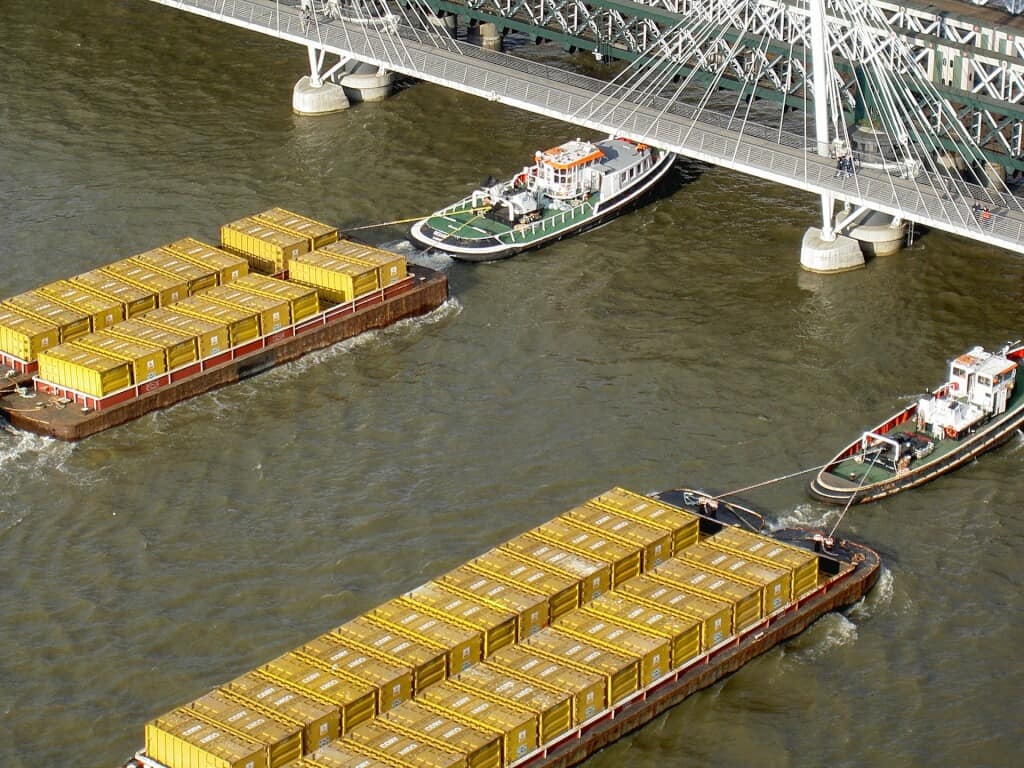
Towing operations involve the pulling of a vessel (it can be a barge, ship or an offshore structure) using another vessel (usually a tug).
From a very basic point of view, we can draw the following conclusions regarding towing
- A bigger vessel will require higher force for towing
- The harsher the environment, the more will be the towing force required
- The efficiency of the tug deployed for towing will also affect the towing operation
When selecting and deploying tugs for towing operations, we would like to know a few things before we make a final decision:
- How big a tug should I select for safely towing the vessel?
- How much maximum speed will I be able to make with the tug(s) I selected?
Each of the above questions merits a detailed explanation, and we will cover each of them separately. In this Article, we will cover the first question – how big a tug is required for safe towing of a vessel?
First, let’s clear some basic concepts. Please note that this article covers only the scenario of head sea towing.
SECTION B – BASIC CONCEPTS
The capacity of tugs is measured by their rated Bollard Pull. The Bollard Pull of a tug is the force it exerts at zero forward speed, in calm water conditions, with the engine working at its full power (100% MCR). Continuous Bollard Pull (CBP) is measured by a test as the average bollard pull measured at a length of time (say 10 minutes), while Maximum Bollard Pull is the highest bollard pull measured during the test.
Concept – Towing Efficiency and available pulling force at zero speed
Source: pixabay
The tug has an efficiency of its own when towing the vessel in sea. It depends on the environment of the tow, and on size of the vessel towed.
If the bollard pull of a tug is denoted by BP, and its towing efficiency is denoted by ƞ, then the total available pulling force from the tug will be
Available pulling force of the tug = Bollard Pull of the tug x Towing efficiency
Available Pulling force of the tug = BP x ƞ
Concept – Required Towing Force
How do we relate the Bollard Pull of the tug to the vessel being towed?
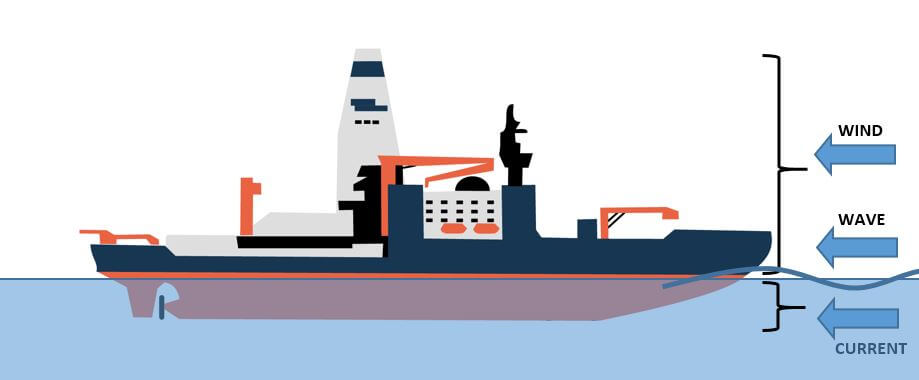
Basically, the vessel being towed will experience environmental forces of wind, wave and current in the sea. Together, these forces constitute the ‘Towing force’. Let’s denote it by FTOT
For the tug to be able to pull the vessel, the available pulling force of the Tug must be greater than the total force on the vessel.
- BP x ƞ > FTOT
- BP > FTOT/ ƞ
Thus the Bollard Pull of the tug should be more than FTOT/ ƞ. This is called the Required Bollard Pull, and this is what we seek to calculate. Next we will see how the towing force can be calculated.
Concept – Environmental forces
The required Towing force is defined as the force which is required to HOLD the vessel in sea under certain environmental conditions of wind, wave and current.
Total Towing Force, FTOT = Wind Force + Wave force + Current force
Please note that the towing force is the required force for HOLDING the vessel (also called STALL condition), and not for towing it.
Now, what are these environmental conditions and where do we get them from?
When towed in the sea, a vessel will experience forces of wind, wave and current. To HOLD the vessel in the given environment, we need to overcome these forces.
- Wind force acts on the part of the vessel above waterline and exposed to wind
- Current force acts on the underwater portion of the vessel
- Wave forces – the waves coming on to the vessel add to the resistance force on the vessel
Wind forces depend on the wind speed, current forces depend on the current speed and Wave forces depend on the (significant) height of waves.
Industry standards like DNV GL Guidelines for Marine Transportation (earlier ND-0030, now superseded by DNVGL-ST-N001) prescribe the standard wind, wave and current parameters to be used for bollard pull calculations, depending on condition under which the towing is being performed.
ND-0030 requires that the bollard pull of the tug should be sufficient to HOLD the towed vessel in the environment stated below:
Standard Criteria – For Open Ocean tows, following environmental parameters are prescribed as per ND-0030
- Wind Speed – 20 m/s (roughly 40 knots)
- Current speed – 0.5 m/s (roughly 1 knot)
- Significant Wave Height – 5 meters
For benign weather areas, the following criteria are prescribed as per ND0030
- Wind Speed – 15 m/s (roughly 30 knots)
- Current speed – 0.5 m/s (roughly 1 knot)
- Significant Wave Height – 2 meters
A question naturally arises – how do we know if the tow is an open ocean tow or a benign tow? For this we need to study the environment of the route of the tow, and get the historical environment data of the route. We can get it from environment data provider like Metocean. In some cases, data from Nautical charts is also acceptable (depends on the discretion of Marine Warranty Surveyor). The wind speed, wave height and current speed should be obtained for the specific time of the year when the tow is expected to take place. For example, if the towing operation is expected in May +/- 2 months, then the environment data from March till July should be referenced. The most extreme values for the period should be utilized.
From the environment data, we can decide whether it is an open ocean tow or a benign tow. Basically, if anywhere along the route a wave of (significant) height more than 2 meters is expected, then the Open Ocean criteria is to be used. If everywhere along the route, waves of significant wave height less than 2 meters are expected, then the environment data must be submitted to the Warranty Surveyor and exemption obtained for using the ‘benign’ sea state case before proceeding with Bollard Pull calculations.
SECTION C – CALCULATION STEPS

Now we can delineate the steps for performing Required Bollard Pull calculations for towing a vessel as follows:
- Step 1 – Determine the environmental parameters (Open Ocean or Benign)
- Step 2 – Calculate the Wind, Wave and Current forces on the vessel
- Step 3 – Add up the wind, wave and current forces to find the total force on the vessel, FTOT
- Step 4 – Get the towing efficiency of the tug, ƞ
- Step 5 – Calculate the minimum required Bollard Pull (BP) using the formula
Minimum Required BP > FTOT/ ƞ
Now we will discuss the calculation methods in detail.
SECTION D – CALCULATION METHODS IN DETAIL

Wind forces
Wind forces are the forces on the part of the vessel above the waterline which is exposed to winds.
For calculating wind force, besides the wind speed and air density, we need the Transverse wind-exposed sectional area of the vessel (also called windage area)
Calculating the transverse windage area
When the vessel is being towed forward, then the transverse section of the vessel faces the winds head on.
Some points to keep in mind when calculating this transverse windage area are:
- There are two parts of the windage area – the area contributed by the part of the vessel’s hull above water, and the area contributed by items on the deck, i.e., Cargo, Deck structures and Accommodation
- The area contributed by the hull can be obtained from the midship section dimensions/drawing
- The area contributed by above-deck items can be calculated as the area of the silhouette of the above deck items.
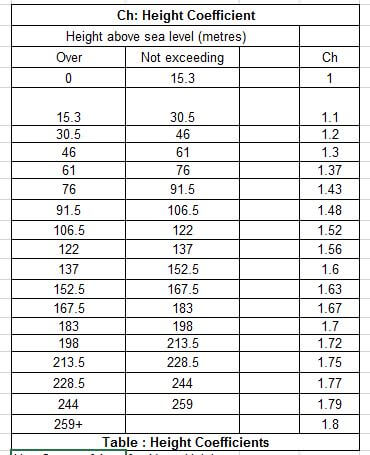
- Cargo height coefficient – The speed of wind varies with the height above the water surface. For zones of the cargo which are higher, a cargo height coefficient needs to be additionally applied to take into account the higher wind speeds experienced by higher zones of the cargo. Cargo height coefficients are provided in ABS MODU Rules (see below)
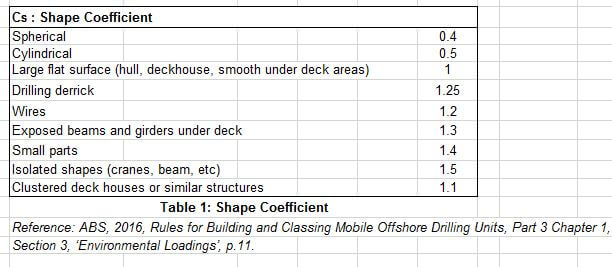
- Cargo shape coefficient – The wind force experienced by the cargo also depends on the shape of the cargo. For example, a box shaped cargo will experience higher forces than cargo which is cylindrical in shape (with the cylindrical face exposed to wind). To take into account the effect of cargo shape on wind force, a cargo shape coefficient needs to be incorporated in the windage area calculations. Cargo shape coefficients for typical cargo shapes are provided in ABS MODU Rules (see below)
- The final windage area should incorporate the height and shape coefficients
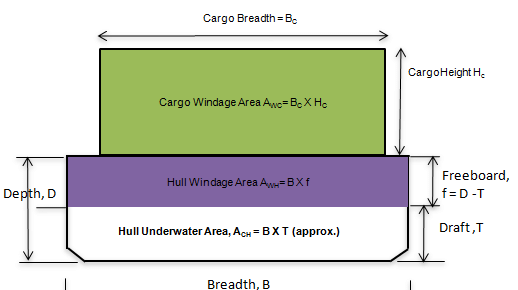
Sketch showing the Transverse Windage Area and Transverse Underwater Areas of a simple Barge
The wind force is calculated from the air density, wind speed and the transverse windage area using standard formula
Force = ½ x air density x (wind speed)2 x Transverse Windage Area
Current forces
The current forces are basically, the forces experienced by the underwater part of the hull.
The underwater part of the hull experiences what is called as ‘calm water resistance’. This is the resistance the ship experiences when it is moving in water without waves.
In the STALL scenario when the tow is not moving, the vessel is actually static, but the current moving against the vessel creates the same effect as the vessel moving with the speed of the current in calm water. Thus, the resistance experienced by the vessel because of current is equivalent to the resistance which the vessel will experience in calm water when moving at the speed of the current.
The Calm Water Resistance has many components, and is a complicated calculation. Calm water resistance of a ship can be calculated using
- Empirical methods like Holtrop-Mennen method, Taylor’s method etc. Each method is applicable to certain ship types
- Direct Model Tests
- Computer simulation
Barges
For barges, some studies have been done to develop empirical methods of calculating resistance. Some of them are
- Bureau Veritas – Towage at Sea of Vessels or Floating Units
- Offshore Technology Conference (OTC) Paper 3320 – Resistance of Offshore Barges and Required Horsepower
If the vessel is a barge, sometimes a simplification is adopted, subject to acceptance by MWS. Similar to the calculation of transverse wind force, the current force can also be calculated from the transverse underwater area.
Calculation of transverse underwater hull area is pretty simple in case of barges, which generally have a rectangular section shape. If the width of the Barge is B, and its draft is T, then the underwater transverse section area is simply B x T. If there are cuts around the bilge of the barge, these can be deducted from the area. The current force is finally calculated using the standard formula
Current force = ½ x water density x (current speed)2 x underwater transverse section area
Ships
For ships, an elaborate method (e.g., Holtrop-Mennen method) to calculate calm water resistance is usually recommended to get more accurate current force.
Wave forces
The current force calculated above is actually the force which the vessel will experience in calm water. However, the sea is a dynamic environment because of waves which the vessel encounters. These waves add to the forces on the vessel and are these forces are called as ‘Added Wave Resistance’ or the ‘wave drift force’.
Wave drift force depends on the dimensions of the vessel, and its shape. The method for calculation of added wave resistance is provided in DNV-RP-H103 Modelling and Analysis of Marine Operations Sec 7.2.6 (see below extract).
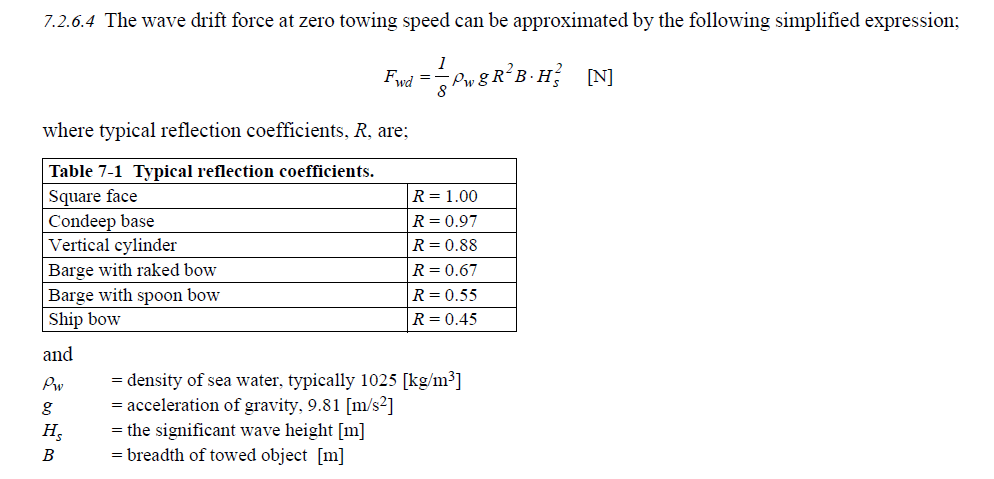
Source: DNV-RP-H103 Modelling and Analysis of Marine Operations
Towing Efficiency
How do we get towing efficiency?
The tug’s efficiency is affected by many factors, like, size of tug, the harshness of environment, and the towing speed. ND-0030 provides a table to calculate the towing efficiency of the Tug. If the tug’s Continuous Bollard Pull is BP, then the table provides following values for the Towing efficiency
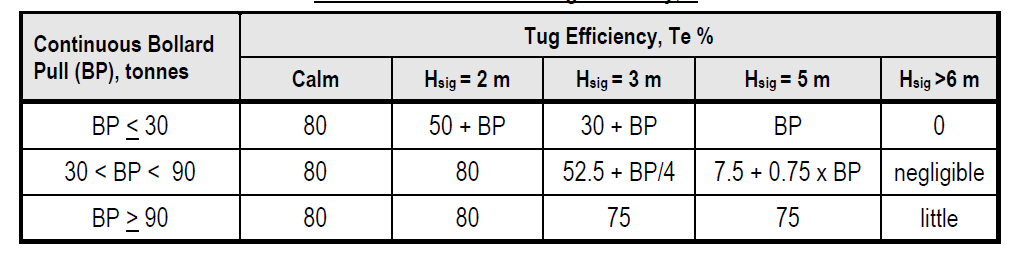
Source: ND-0030 Guidelines for Marine Transportations
Calculation of Required Bollard Pull
Now that we have the wind, wave and current forces, we can calculate the total resistance force on the vessel as
FTOT = FWIND + FWAVE + FCURRENT
Then the required Bollard Pull can be calculated as
Required BP = FTOT/ƞ
The continuous bollard pull of tug must be higher than the Required BP for the tug to be suitable for towing.
SECTION E – The role of Marine Warranty Surveyor (MWS)
The Marine Warranty Surveyor has a very critical role in towing operations. His role includes, but is not limited to
- Survey of vessel and tug for towing equipment and general condition
- Approval and acceptance of environmental conditions/weather data
- Review of the bollard pull calculations
- Witness and review of Bollard Pull tests, if required to be performed
- Review and approval of the towing plan
The towing operator has to work closely with the MWS by providing all documents and calculations on time and getting MWS approvals prior to the operation. The potential areas of contention with the MWS might be the following, and the towing operator should carefully prepare the supporting documents to get MWS approval in time
- Disagreement over environmental criteria adopted
- Non-willingness of MWS to grant benign weather criteria
- Disagreement over the method adopted for Bollard Pull calculation
- Disagreement over the condition of the tug
- Insistence to carry out a Bollard Pull test to confirm the rating of the tug
While the above are not regular occurrences, it is advisable for the towing operator to be proactive in treading these issues to avoid delays and surprises during the operation.
That leads to the conclusion of this Part – I. In Part – II we will discuss the method of calculating the maximum feasible towing speed for a given environment.
References
- DNV RP-H103 Modelling and Analysis of Marine Operations
- ABS, 2016, Rules for Building and Classing Mobile Offshore Drilling Units, Part 3 Chapter 1,Section 3, ‘Environmental Loadings’, p.11.
- An Approximate Power Prediction Method, J.Holtrop and G.G.J.Mennen, 1982
- BV – Towage at Sea of Vessels or Floating Units
- OTC 3220, Vol 4, Resistance of Offshore Barges and Required Tug Horsepower.
Bollard Pull Calculations – an Introduction (Part II)
-
 Bollard Pull Calculations for Towing OperationsPart II – Finding out the maximum feasible tow speed(To read Part I, please click here)IntroductionThis is Part – II of the two part article on Bollard Pull calculations. In the Part I we saw how to calculate the required Bollard Pull to select a tug. At this stage, we have accomplished the following
- Calculated the required Bollard Pull (BP) to tow the vessel (barge or ship)
- Selected the tug based on the required Bollard Pull
In this part we will see how we can estimate the maximum safe towing speed for the vessel to ply in a given sea state. Before we get to the actual methodology, let’s look at the concept of Available Pull of the tug at non-zero speed.Concept – Available pull of the tug at non zero-speedBy now we have selected the tug, and it has its rated bollard pull, which is its maximum pulling force at zero forward speed. Let’s call it BPmax. As we saw in Part I, this BPmax should be more than the total required towing force for the STALL condition. However, the actual towing scenario (called the TOW condition) is different in two ways- First, the tug is not static but towing the vessel forward at a non-zero speed. When the tug moves forward, part of the tug’s power is used in overcoming the resistance of the tug itself, and the rest is actually available to tow the vessel. Let’s say, if Ftug is the force which the tug utilizes for itself, then the available power for towing (BPavailable) will be
BPavailable = BPmax – FtugAt zero speed, Ftug is zero, and whole BPmax is available for the holding the towed vessel. At the maximum free-running speed of the tug, the whole BPmax is utilized for the tug’s own resistance, and the available power for towing is zero. Thus, if we plot the available towing power of the tug vs speed, we will get a curve like below. The actual curve is not exactly a straight line, but we will assume a straight line to keep things simple (it also leads to more conservative results).In the example above, we can see that at 6 knots towing speed, the maximum available power for towing is only 40% of the BPmax, while 60% goes to overcome the tug’s own resistance- Second, the environment under which towing is performed is not the same as the STALL environment scenario. Usually, the STALL sea state is a harsher one in which the requirement is to HOLD the tow, and not move it forward. The towing will be done is a comparatively milder environment.
Our objective is to find out the maximum speed which the tug can make in a given environment.MethodologyThe methodology which we are going to follow for the above exercise is outlined below- Step 1 – Get the environmental parameters under which the towing will be done
- Step 2 – Get the tug particulars
- Bollard Pull at 100% and 85% MCR or other MCR values as required
- Tug maximum forward free run speed
- Step 3 – Plot the tug performance curves for different MCR values
- Step 4 – Calculate the total environmental forces (on the towed vessel) for different speed of towing, beginning from zero speed up to the maximum tug speed
- Step 5 – Plot the curve of Total Environmental force (FTOT) vs towing speed on the same graph as the tug performance curve.
- Step 6 – The intersection of the curves for total environmental force and tug performance will give the limiting towing speed
Let’s now see each step in detail Step 1 – Get the environmental parametersThe environmental parameters for towing in this case are the maximum wind, current and wave in which the towing operator proposes to tow the vessel. The towing operator has to advise the safe limiting environment in which she/he plans to tow. For example, the operator may decide that a wind of 20 knots, wave of 3 m and current of 1 knots is the limiting environment in which she/he plans to tow the vessel. The operator would like to know the maximum speed she/he can make with this limiting environment.Step 2 – Get the tug particularsWe saw that the available power for towing keeps reducing with speed of tow. The performance curve of the tug is an important input for determining the available power. For plotting the performance curve, we need the following:
- The free running maximum speed of the tug – this is obtained from the tug’s specifications sheet
- The Bollard Pull of the tug at 100% MCR and 85% MCR. Usually the tug will be operated at 85% MCR. 100% MCR is more significant for the STALL condition to calculate the maximum required Bollard Pull. If the tug is operating at some other MCR value, then the Bollard Pull for that value should also be obtained.
Step 3 – Plot the tug performance curveOnce we have the above data, we can plot the tug performance curves for 100% & 85% MCR (or any other value) using the method described in Section 2.Step 4 – Calculate the total environmental forces for different tow speeds- Wind and current forces are calculated using standard formulas described in Part I.
- The wind and current forces will keep increasing as the tow speed increases. This is because the effective (or relative) wind/current speed against the vessel increases as the vessel moves forward. If the speed of the tug is Vtow, and speed of the wind is Vwind, then the effective wind speed is
Veffective = Vtow + VwindThe wind force will have to be calculated for the above effective speed. Same holds true for the current force- The wave force is calculated based on DNV-RP-H103 Sec 7.2.6. The wave force also increases with the towing speed, and is calculated in accordance with the relevant sections of DNV.
- Once we have the wind, wave and current forces, we calculate the total environmental force, FTOW by adding them up. FTOW is calculated for different tow speeds from zero to maximum tug speed.
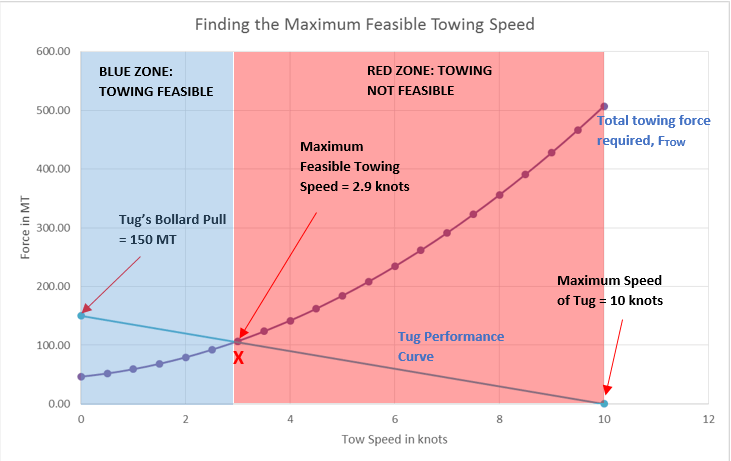
We can do the calculations and present them in a spreadsheet format. Once such calculation table is presented below (speed means towing speed)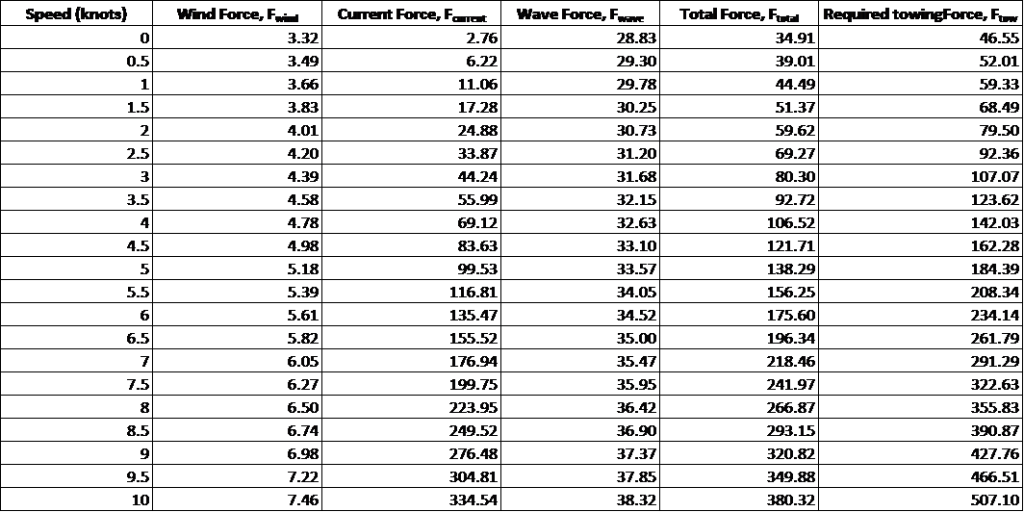 Step 5 – Plot FTOT against tug speed on the same plot as for the tug performance curve.The curve will then look something like the below (the tug’s bollard pull is 150 MT)Step 6 – Finding the limiting towing speedThe intersection of the curves for total environmental force and tug performance will give the limiting towing speed. In the above plot, the point ‘X’ is the intersection of the two curves. We can see that at all points to the left of the point ‘X’ (i.e., speeds less than 2.9 knots marked by blue zone), the available towing pull of the tug exceeds the required towing force, thus making the towing feasible. However, to the right of point ‘X’ (the red zone), the available tug power is less than the towing force required and towing is not feasible. Thus the maximum towing speed feasible for this case is 2.9 knots.Thus we saw how the maximum feasible towing speed can be calculated for towing a vessel under a given environment. This exercise becomes useful when the Client or MWS requires that a minimum towing speed be achieved and demonstrated through calculations.That brings us to the end of this two-part article on Bollard Pull. We hope it has been useful to our readers. Do let us know your thoughts in the comment section. Happy Towing!!
Comments
Post a Comment